4lowTheRabbit.github.io
Workshop - High Memory Site
Environment setup
Provision the resource
First of all, click the Deploy to Azure button on the README page of this workshop’s GitHub repository.

Follow the wizard to provision the resource.

After the deployment is done, a resource group will be created with the following resource items:
- An app service plan
- An app service site

The code which “leaks” memory
This lab is based on the following code, which has an OutputCache configured to cache the responses of the Cached action for 3 days. Another action Index sends requests to Cached, with a different id parameter value in each request. Due to OutputCache is configured to vary by parameter id, every request from Index to Cached adds one more cached response item in the output cache.
These memory is hold up by the cache for 3 days, which contributes to the Committed Bytes metric of the process.
There are real-world web applications who “leak” memory due to unsophisticated cache algorithm and configurations.
public class ReproController : Controller
{
    static volatile int id = 0;
    static HttpClient client = new HttpClient();
    public async Task<ActionResult> Index()
    {
        string schema = Request.IsSecureConnection ? "https": "http";
        string serverName = Request.ServerVariables["server_name"];
        string serverPort = Request.ServerVariables["server_port"];
        string path = Request.ApplicationPath;
        string urlString = $"{schema}://{serverName}:{serverPort}{path}Repro/Cached/{id++}";
        string response = await client.GetStringAsync(urlString);

        ViewData["URL"] = urlString;
        ViewData["Response"] = response;
        return View();
    }

    [OutputCache(Duration = 3*24*60*60, VaryByParam = "id")]
    public ActionResult Cached(int id)
    {
        ViewBag.Id = id;
        return View();
    }
}
Repro the high memory issue
In order to repro the high memory issue in this lab site, we can take the following steps:
-
Launch a Linux Bash shell
I use Ubuntu via the Windows Subsystem of Linux.
-
Run the following commands to install the
abutilitysudo apt update sudo apt install apache2-utils -
Use
abto send 100000 requests to the site.Replace the site name below with yours.
ab -n 100000 -c 5 -s 300 -k http://labmemoryleaksite33c9.azurewebsites.net/repro -
Under
Memory AnalysisofDiagnose and solve problems, observe thePhysical Memory Usagemetric of the site climbs up, when requests are sent to the site byab. So does the
 Committed Memory Usagemetric of the instance.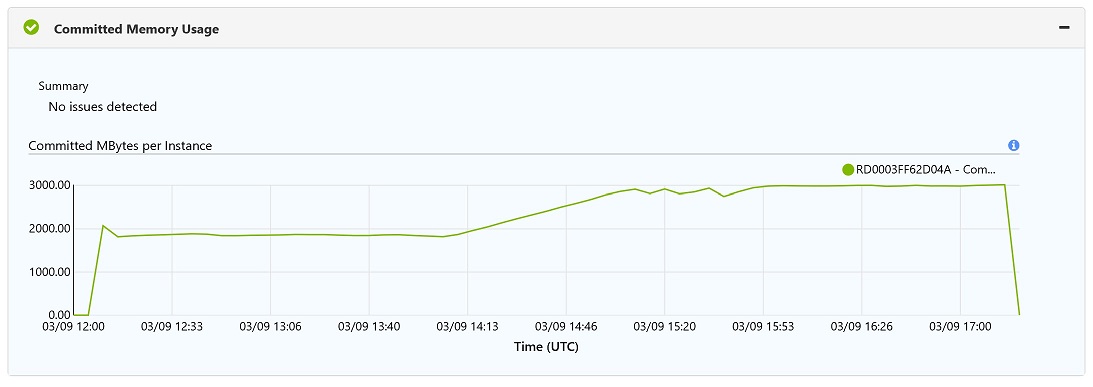
Troubleshoot the high memory issue
Collect a dump file when process memory is high
-
On the Azure portal, in the
Diagnose and solve problemsblade of the site, clickMemory Dumpin theDiagnostic Toolstile. -
Select
ASP.NETas the application stack and then click theCollect Memory Dumpbutton. -
Select
Collect Data Onlyand then clickCollect Memory Dumpwhen memory is high.
-
It can take a few minutes for the diagnostic tool to write the big memory dump file. After that, click the download link to download the .dmp dump file.

Use Visual Studio to do memory usage analysis
- Drag & drop the dump file to Visual Studio 2019.
-
Click the
Debug Managed MemoryAction
-
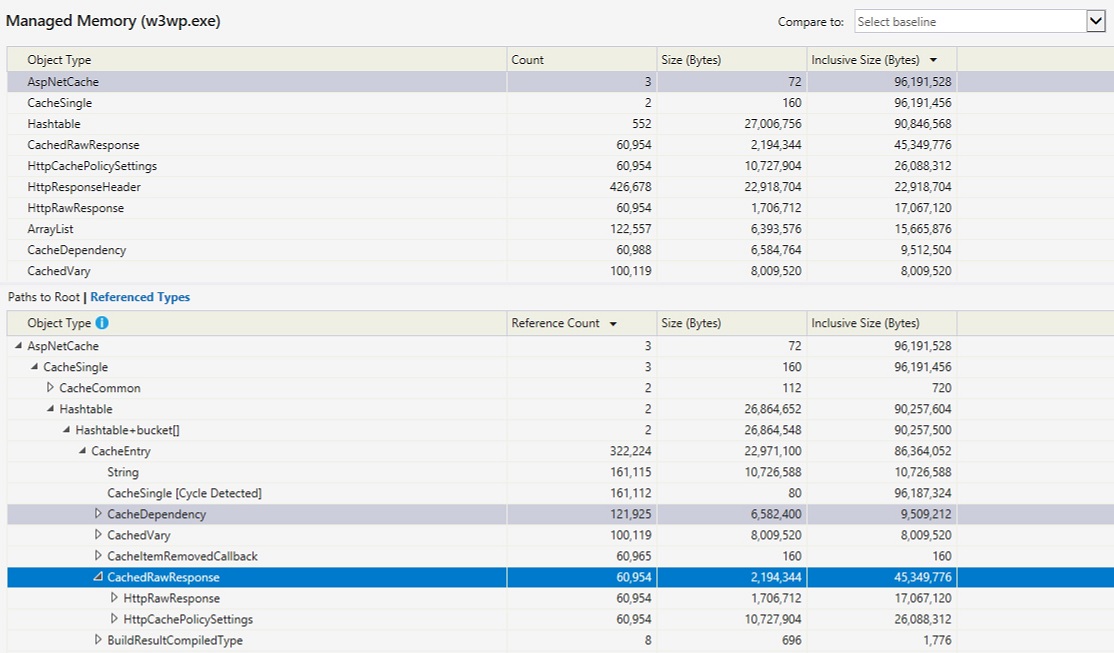
In the usage report, we can see that ASP.NET Cache is responsible for most of the memory objects.
Use PerfView to do memory usage analysis
-
Download and install PerfView from its Download Page.
-
From PerfView’s memu, select
memory->Take Heap Snapshot From Dump.
-
Enter path of the dump and the output files and then click the “Dump GC Heap” button.

-
The report shows that the ASP.NET cache is responsible for most of the memory usage.

Use WinDBG to do memory usage analysis
-
Search WinDBG in windows 10’s Microsoft store app

- Install and launch the WinDbg app
-
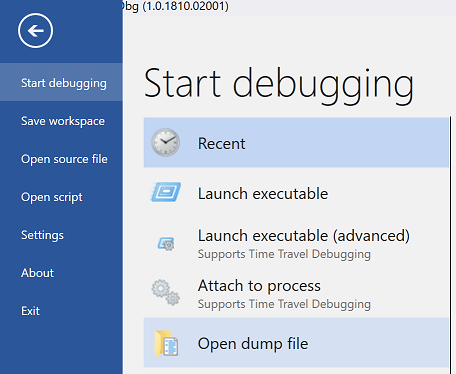
Open the .dmp dump file by WinDbg
Note: This is a 32bit process, since the debugger shows
Free X86 compatiblewhen loading the dumpWindows 10 Version 14393 UP Free x86 compatible Product: Server, suite: TerminalServer DataCenter SingleUserTS 10.0.14393.2430 (rs1_release_inmarket_aim.180806-1810) Machine Name: Debug session time: Sun Mar 10 02:00:27.000 2019 (UTC + 8:00) System Uptime: 10 days 13:36:44.128 Process Uptime: 0 days 5:44:33.000Please be patient for WindBG to load all symbol files. It will take a few minutes for the first time when debugging a dump.

-
Load the 32bit version of debugger extension for .NET Framework, by running the following command.
.load C:\Windows\Microsoft.NET\Framework\v4.0.30319\sos.dll -
Run
!DumpHeap -statto dump out memory usage grouped by type names.We can see that
System.Stringtakes most of the memory.... 7205f698 164327 2680860 System.String[] 720632d0 127250 3054000 System.Collections.ArrayList 720748c4 117260 3752320 System.Action`2[[System.Object, mscorlib],[System.EventArgs, mscorlib]] 7205ef34 127999 3869232 System.Object[] 6fd6f4d0 117254 4221144 System.Web.Caching.CacheDependency 6fd41554 100119 4405236 System.Web.Caching.CachedVary 72061ab8 1898 4689120 System.Collections.Hashtable+bucket[] 6fd6d760 1327 4771892 System.Web.Caching.UsageEntry[] 057c7888 106360 6427088 Free 6fd533e8 426678 8533560 System.Web.HttpResponseHeader 6fd54a90 60954 9752640 System.Web.HttpCachePolicySettings 6fd6d530 245618 18666968 System.Web.Caching.CacheEntry 7205eb40 842563 53860084 System.String Total 3097304 objects Fragmented blocks larger than 0.5 MB: Addr Size Followed by 15282118 1.3MB 153cc8d0 System.Byte[] -
Dump out the string objects by using their Method Table (MT) values. (MT values of types can be found in the first column of the above command’s output.)
!dumpheap -mt 7205eb40Note: It takes time to dump out all of the string objects in a big dump file. Press CTRL+BREAK to stop, if you want.
Note: We can use
.logopento let the debugger write its output to a disk file and then.logcloseto close it.0:000>.logopen D:\dbg.txt Opened log file 'D:\dbg.txt' 0:000>!dumpheap -mt 7205eb40 ... 0:000> .logclose Closing open log file D:\dbg.txt -
In order to observe how the
Stringobjects are referenced, randomly pick up their memory addresses and run!gcroot %address%.For instance, the following reference chain shows the string object is referenced by the ASP.NET Cache.
 0:000> !gcroot 2b960fe0
 HandleTable:
     06821108 (strong handle)
     -> 06a481f0 System.Web.NativeFileChangeNotification
     -> 06a481cc System.Web.DirMonCompletion
     -> 06a47fe8 System.Web.DirectoryMonitor
     -> 06a48010 System.Collections.Hashtable
     -> 06a48044 System.Collections.Hashtable+bucket[]
     -> 06a480f4 System.Web.FileMonitor
     -> 06a48128 System.Collections.Specialized.HybridDictionary
     -> 06a4816c System.Collections.Specialized.ListDictionary
     -> 06a48188 System.Collections.Specialized.ListDictionary+DictionaryNode
     -> 068f931c System.Web.FileChangesMonitor
     -> 068f93cc System.Collections.Hashtable+SyncHashtable
     -> 068f9358 System.Collections.Hashtable
     -> 06a8c25c System.Collections.Hashtable+bucket[]
     -> 06a8c154 System.Web.FileMonitor
     -> 06a28e78 System.Web.DirectoryMonitor
     -> 06a28ea0 System.Collections.Hashtable
     -> 06a8c1b0 System.Collections.Hashtable+bucket[]
     -> 06a290f0 System.Web.FileMonitor
     -> 06a29124 System.Collections.Specialized.HybridDictionary
     -> 06a2914c System.Collections.Specialized.ListDictionary
     -> 06ab6708 System.Collections.Specialized.ListDictionary+DictionaryNode
     -> 06ab6644 System.Web.Caching.CacheDependency
     -> 06ab6878 System.Action`2[[System.Object, mscorlib],[System.EventArgs, mscorlib]]
     -> 06ab682c System.Web.Caching.CacheEntry
     -> 068faaf0 System.Web.Caching.CacheSingle
     -> 068fab34 System.Collections.Hashtable
     -> 07d58bc8 System.Collections.Hashtable+bucket[]
     -> 2b961130 System.Web.Caching.CacheEntry
     -> 2b96117c System.Web.Caching.CacheDependency
     -> 2b961250 System.Action`2[[System.Object, mscorlib],[System.EventArgs, mscorlib]]
     -> 2b961204 System.Web.Caching.CacheEntry
     -> 2b960fe0 System.String

 Found 1 unique roots (run '!GCRoot -all' to see all roots).
Here is my debugger’s output, for download.
Clean up
Delete the resource group of this workshop to delete the resource items and save the cost.